Code
library(ggplot2)This is a dashboard for the data collection and cleaning process.
All code is “folded” by default. Select “Show All Code” from the menu at the upper right to reveal the code chunks.
This page was last rendered on 2025-04-22 16:35:26.795147.
We load ggplot2 to make the following plot commands easier to type.
library(ggplot2)The data are stored in a Google sheet that we download again if params$update_data == TRUE. Otherwise, we make use of a stored data file.
if (!dir.exists(params$data_dir)) {
  message("Creating missing ",  params$data_dir, ".")
  dir.create(params$data_dir)
}

project_ss <- params$google_data_url

if (params$update_data) {
  if (params$use_sysenv_creds) {
    google_creds <- Sys.getenv("GMAIL_SURVEY")
    if (google_creds != "") {
      options(gargle_oauth_email = google_creds)
      googledrive::drive_auth()
    } else {
      message("No Google account information stored in `.Renviron`.")
      message("Add authorized Google account name to `.Renviron` using `usethist::edit_r_environ()`.")
    }
  }

  papers_data <- googlesheets4::read_sheet(ss = project_ss,
                            sheet = params$sheet_name)
  out_fn <- file.path(params$data_dir, params$data_fn)
  readr::write_csv(papers_data, out_fn)
  message("Data updated: ", out_fn)
} else {
  message("Using stored data.")
  papers_data <- readr::read_csv(file.path(params$data_dir, params$data_fn),
                                 show_col_types = FALSE)
}
✔ Reading from "Legacy Project Acuity Data: By Paper".✔ Range ''paper_data''.Data updated: data/csv/paper-sources.csvWe have configured Paperpile to synch a .bib formatted file directly with this repo on GitHub. The files can be found here: src/data/*paperpile*.bib.
We import data/paperpile-tac-has-pdf.bib and data/paperpile-tac-no-pdf.bib separately; add a variable indicating whether we have or do not have a PDF; then, join the two data data frames.
refs_w_pdf <- bib2df::bib2df("data/paperpile-tac-has-pdf.bib", separate_names = TRUE)Some BibTeX entries may have been dropped.
The result could be malformed.
Review the .bib file and make sure every single entry starts
with a '@'.Column `YEAR` contains character strings.
No coercion to numeric applied.refs_w_pdf <- refs_w_pdf |>
dplyr::mutate(pdf = TRUE)We have 432 papers with PDFs to process.
refs_no_pdf <- bib2df::bib2df("data/paperpile-tac-no-pdf.bib", separate_names = TRUE)Some BibTeX entries may have been dropped.
The result could be malformed.
Review the .bib file and make sure every single entry starts
with a '@'.Column `YEAR` contains character strings.
No coercion to numeric applied.refs_no_pdf <- refs_no_pdf |>
dplyr::mutate(pdf = FALSE)We have 421 papers without PDFs to process. In a separate workflow, we will try to access these papers via the PSU Libraries and other sources.
refs_all <- dplyr::full_join(refs_w_pdf, refs_no_pdf)Joining with `by = join_by(CATEGORY, BIBTEXKEY, ADDRESS, ANNOTE, AUTHOR,
BOOKTITLE, CHAPTER, CROSSREF, EDITION, EDITOR, HOWPUBLISHED, INSTITUTION,
JOURNAL, KEY, MONTH, NOTE, NUMBER, ORGANIZATION, PAGES, PUBLISHER, SCHOOL,
SERIES, TITLE, TYPE, VOLUME, YEAR, JOURNALTITLE, ISSUE, DATE, DOI, PMID, ISSN,
URL, LANGUAGE, KEYWORDS, PMC, URLDATE, ORIGTITLE, LOCATION, EVENTTITLE, VENUE,
ISBN, PAGETOTAL, pdf)`The author and editor fields are imported as lists. We need to merge these into character strings to re-import the data back into Google Sheets.
# Create function to change AUTHOR list to a string array
make_author_list <- function(df) {
  unlist(df$full_name) |> paste(collapse = "; ")
}

make_editor_list <- function(df) {
  if (is.na(df$full_name)) {
    ""
  } else {
  unlist(df$full_name) |> paste(collapse = "; ")
  }
}

authors_string <- purrr::map(refs_all$AUTHOR, make_author_list) |>
  purrr::list_c()

editors_string <- purrr::map(refs_all$EDITOR, make_author_list) |>
  purrr::list_c()

refs_all <- refs_all |>
    dplyr::mutate(YEAR2 = stringr::str_extract(DATE, "^[0-9]{4}"))

new_refs_all <- refs_all |>
  dplyr::mutate(authors = authors_string,
                editors = editors_string) |>
dplyr::select(-c("AUTHOR", "ANNOTE", "EDITOR"))We the push the cleaned data back to Google Sheets for further analysis and processing.
We do not push the cleaned data back to the original sheet but to a new one to avoid overwriting data.
new_refs_all |>
  googlesheets4::sheet_write(project_ss, "from_paperpile_via_github_cleaned")
✔ Writing to "Legacy Project Acuity Data: By Paper".✔ Writing to sheet 'from_paperpile_via_github_cleaned'.The following uses the new has-pdf/no-pdf export workflow from Paperpile directly to Github.
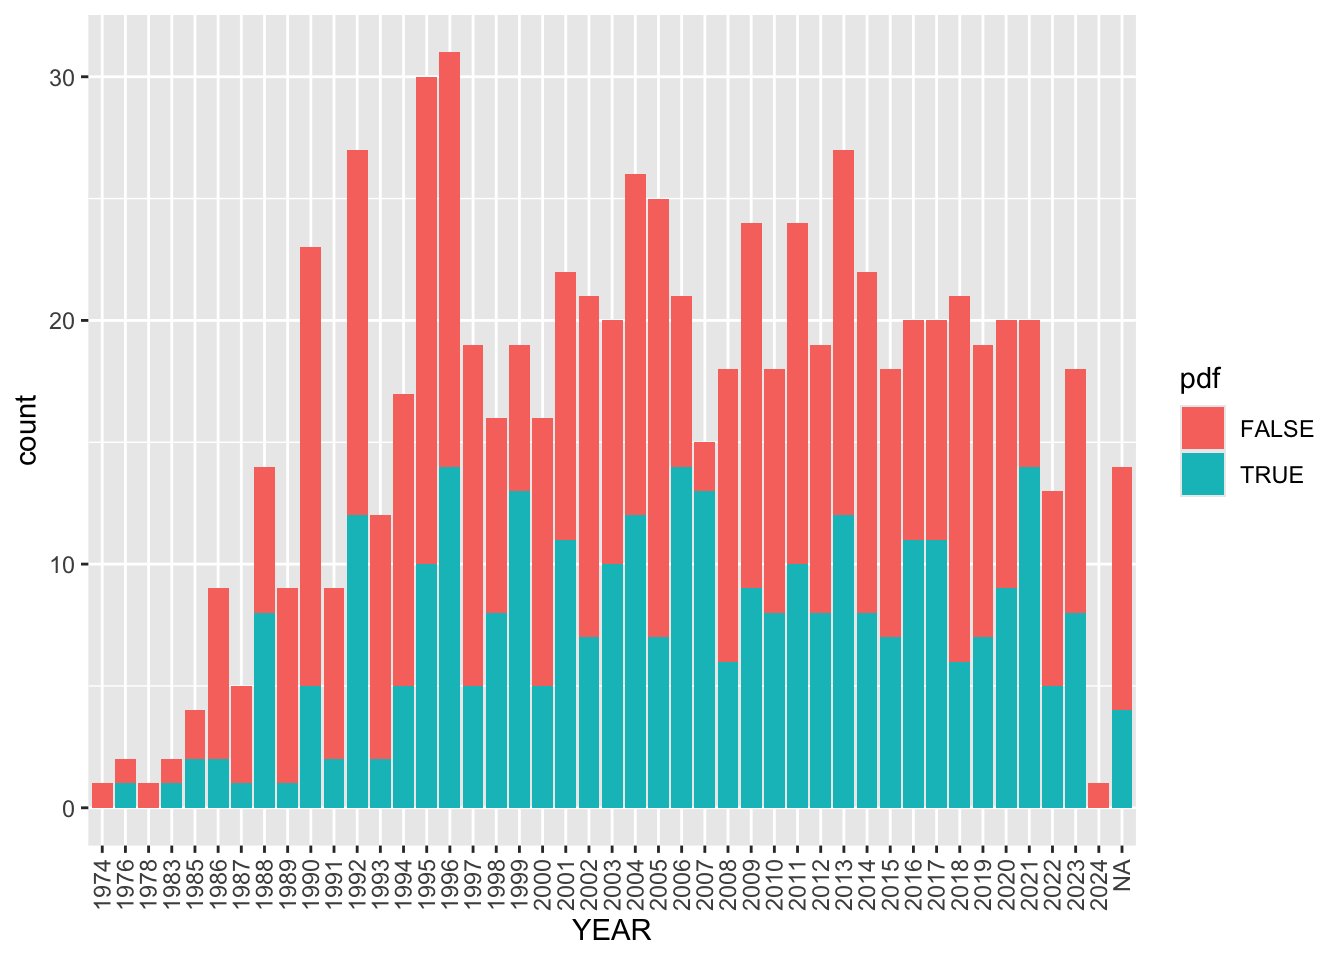
refs_all |>
  dplyr::filter(!is.na(YEAR2)) |>
  ggplot() +
  aes(x = YEAR2, fill = pdf) +
  geom_bar() +
  theme(axis.text.x = element_text(angle = 90, vjust = 0.5, hjust=1))
There are 853 papers in our Paperpile. Of these 432 have PDFs.
This section extracts data about our progress in capturing data tables from these articles.
img_folder <- googledrive::drive_find(type = "folder", q = "name contains 'legacy'")Auto-refreshing stale OAuth token.img_df <- googledrive::drive_ls(img_folder)
img_df <- img_df |>
dplyr::mutate(paper_id = stringr::str_extract_all(name, "[a-zA-Z0-9]+\\-[a-z]{2}"))Now that we have re-extracted the paper_id, we can do some summaries.
n_tables <- dim(img_df)[1]
n_papers <- length(unique(img_df$paper_id))
We have processed 84 papers and 230 tables as of 2025-04-22 16:35:35.050994.
We use the from_paperpile_via_github tab to keep track of our work. So, we first import this sheet.
papers_progress_data <- googlesheets4::read_sheet(ss = project_ss,
                            sheet = "from_paperpile_via_github")
✔ Reading from "Legacy Project Acuity Data: By Paper".✔ Range ''from_paperpile_via_github''.New names:
• `` -> `...1`
• `` -> `...16`Here is a table of the papers processed by each analyst.
xtabs(formula = ~ open_attempt_by, data = papers_progress_data)open_attempt_by
ars bhb hal jmd kgm mro nlc rog sh trw
10 73 17 27 1 2 5 12 2 43 Here is a table of the number of captured figures:
As of 2024-09-05, we do not render this table because number_of_captured_figs is a non-numeric list.
# 2024-09-05 do not evaluate because number_of_captured_figs is a non-numeric list
papers_progress_data |>
  dplyr::filter(!is.na(number_of_captured_figs),
                !is.na(open_attempt_by)) |>
  dplyr::group_by(open_attempt_by) |>
  dplyr::summarise(n_figs = sum(number_of_captured_figs)) |>
  knitr::kable("html")