This page summarizes our analysis and visualization of the reaction time data collected by Andrea Seisler in May 2023 from students at Our Lady of Victory Middle School.
library(tidyverse)
── Attaching core tidyverse packages ──────────────────────── tidyverse 2.0.0 ──
✔ dplyr     1.1.2     ✔ readr     2.1.4
✔ forcats   1.0.0     ✔ stringr   1.5.0
✔ ggplot2   3.4.2     ✔ tibble    3.2.1
✔ lubridate 1.9.2     ✔ tidyr     1.3.0
✔ purrr     1.0.1
── Conflicts ────────────────────────────────────────── tidyverse_conflicts() ──
✖ dplyr::filter() masks stats::filter()
✖ dplyr::lag()    masks stats::lag()
ℹ Use the conflicted package (<http://conflicted.r-lib.org/>) to force all conflicts to become errors
Description of task
Gathering
The data are in a Google sheet that is accessible to the psubrainlab account.
• 'Ruler Reaction Time Test Data (Responses)'
  <id: 1J-S5-kKQpHYW7L1_pqxX57zziS5IPX7ViA2MG3pGFBo>
Saved locally as:
• 'csv/rt-raw.csv'
Now, I reimport the CSV file as a data frame/tibble.
rt <- readr::read_csv("csv/rt-raw.csv")
Rows: 616 Columns: 10
── Column specification ────────────────────────────────────────────────────────
Delimiter: ","
chr (7): Timestamp, Class Period, Male or Female, Hand: Left (L) or Right (R...
dbl (2): Participant ID (4 digits e.g. 7000, 7001), Trial Number
lgl (1): Time (s)

ℹ Use `spec()` to retrieve the full column specification for this data.
ℹ Specify the column types or set `show_col_types = FALSE` to quiet this message.
str(rt)
spc_tbl_ [616 × 10] (S3: spec_tbl_df/tbl_df/tbl/data.frame)
 $ Timestamp                                                          : chr [1:616] "5/5/2023 9:13:37" "5/5/2023 9:16:18" "5/5/2023 9:16:49" "5/5/2023 9:17:43" ...
 $ Class Period                                                       : chr [1:616] "7-101" "7-101" "7-101" "7-101" ...
 $ Participant ID (4 digits e.g. 7000, 7001)                          : num [1:616] 9010 9011 9010 9011 9010 ...
 $ Trial Number                                                       : num [1:616] 1 1 2 2 3 1 1 2 2 3 ...
 $ Male or Female                                                     : chr [1:616] "m" "m" "m" "m" ...
 $ Hand: Left (L) or Right (R)                                        : chr [1:616] "l" "l" "l" "l" ...
 $ Hand: D for (Dominant - the one you write with) OR N (Non-Dominant): chr [1:616] "n" "n" "n" "n" ...
 $ Distance (cm OR drop)                                              : chr [1:616] "21" "23" "13" "11" ...
 $ age-range                                                          : chr [1:616] "child" "child" "child" "child" ...
 $ Time (s)                                                           : logi [1:616] NA NA NA NA NA NA ...
 - attr(*, "spec")=
  .. cols(
  ..   Timestamp = col_character(),
  ..   `Class Period` = col_character(),
  ..   `Participant ID (4 digits e.g. 7000, 7001)` = col_double(),
  ..   `Trial Number` = col_double(),
  ..   `Male or Female` = col_character(),
  ..   `Hand: Left (L) or Right (R)` = col_character(),
  ..   `Hand: D for (Dominant - the one you write with) OR N (Non-Dominant)` = col_character(),
  ..   `Distance (cm OR drop)` = col_character(),
  ..   `age-range` = col_character(),
  ..   `Time (s)` = col_logical()
  .. )
 - attr(*, "problems")=<externalptr>
Cleaning
Let’s drop columns we don’t need or won’t use.
rt <- rt |> dplyr::select(-Timestamp) |> dplyr::rename("class"="Class Period","part_id"="Participant ID (4 digits e.g. 7000, 7001)","trial"="Trial Number","gender"="Male or Female","hand"="Hand: Left (L) or Right (R)","dom_nondom"="Hand: D for (Dominant - the one you write with) OR N (Non-Dominant)","cm"="Distance (cm OR drop)","age_range"="age-range" ) |> dplyr::mutate(cm =as.numeric(cm))
Warning: There was 1 warning in `dplyr::mutate()`.
ℹ In argument: `cm = as.numeric(cm)`.
Caused by warning:
! NAs introduced by coercion
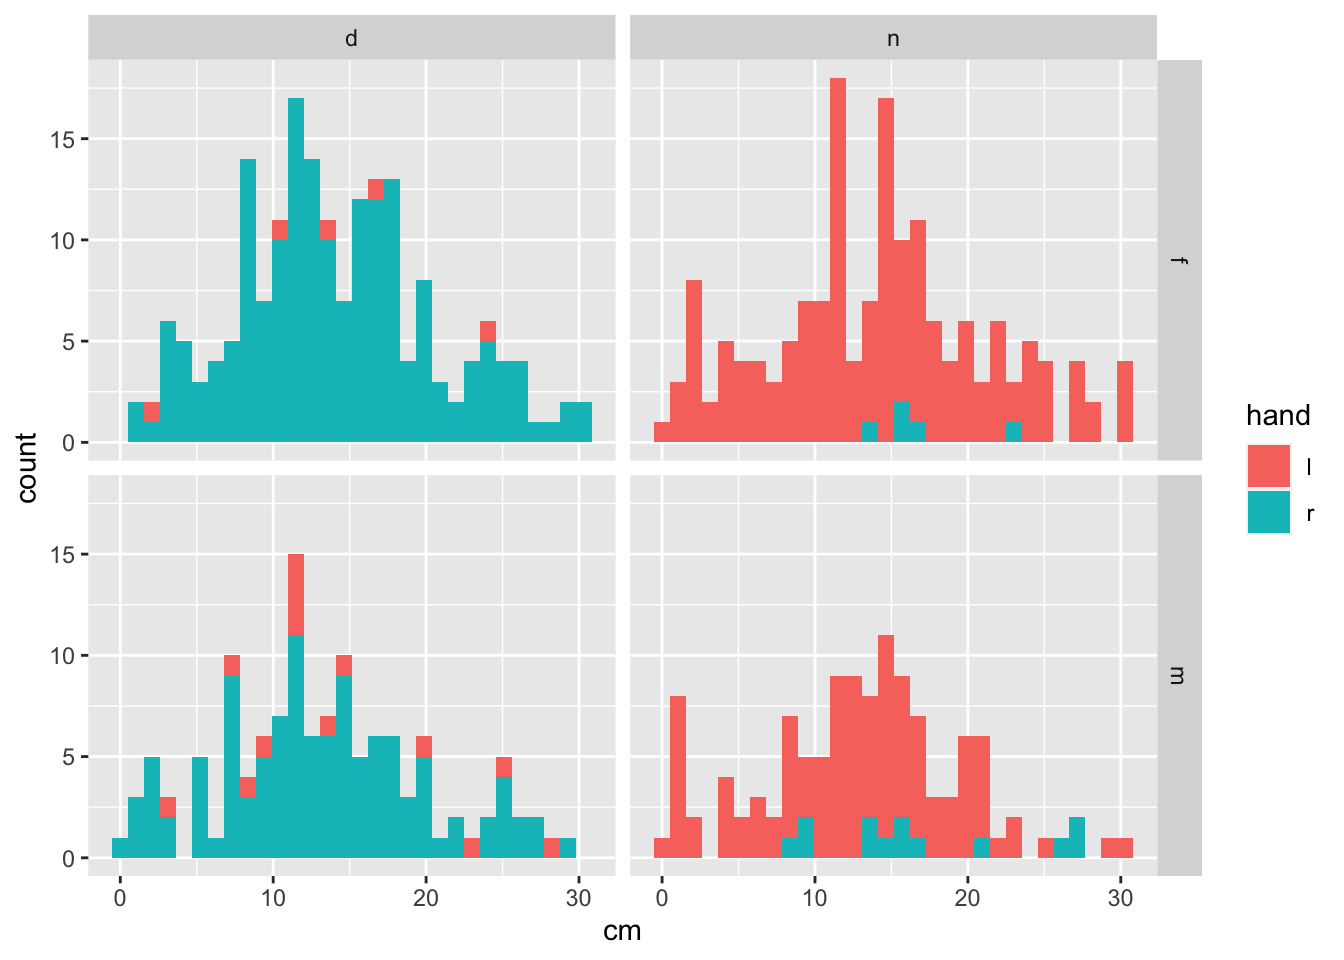
Visualization
rt |>ggplot() +aes(x = cm, fill = hand) +geom_histogram() +facet_grid(rows =vars(gender), cols =vars(dom_nondom))
`stat_bin()` using `bins = 30`. Pick better value with `binwidth`.