Bem, D.J. (2011). Experimental evidence for anomalous retroactive influences on cognition and affect. Journal of Personality and Social Psychology, 100(3), 407-425.
“This article reports 9 experiments, involving more than 1,000 participants, that test for retroactive influence by”time-reversing" well-established psychological effects so that the individual’s responses are obtained before the putatively causal stimulus events occur."
“We argue that in order to convince a skeptical audience of a controversial claim, one needs to conduct strictly confirmatory studies and analyze the results with statistical tests that are conservative rather than liberal. We conclude that Bem’s p values do not indicate evidence in favor of precognition; instead, they indicate that experimental psychologists need to change the way they conduct their experiments and analyze their data.”
I want to do more AWESOME science than I can do on my own
Quantitative developmental science has a bright future
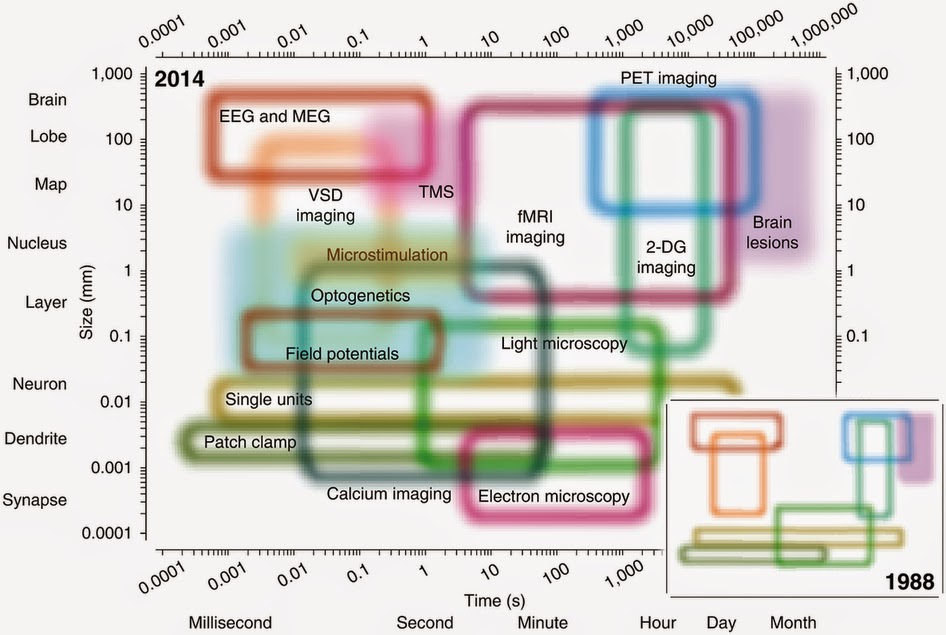
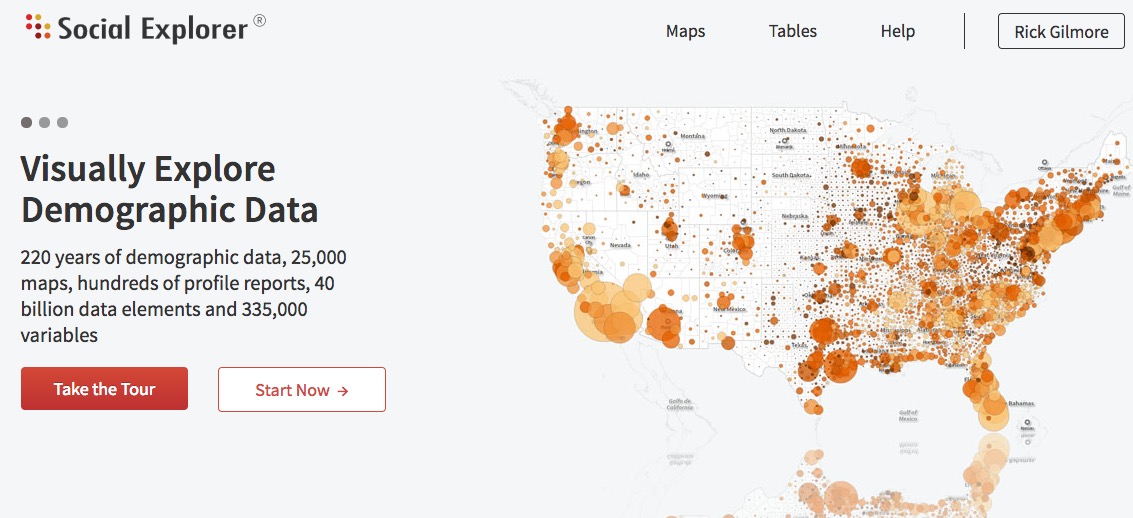
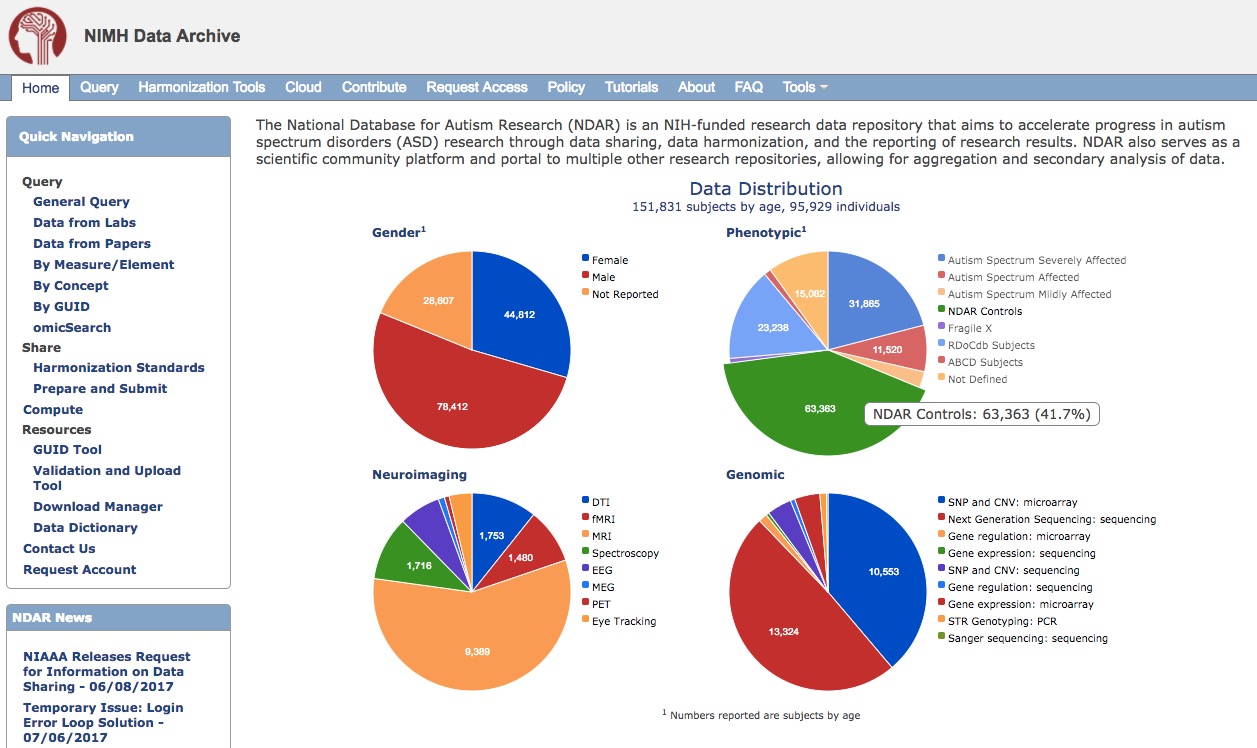
Essentials for computationally intensive behavioral research
Computational resources
Technical expertise
Reproducible workflows
Kitzes, J., Turek, D., & Deniz, F. (Eds.). (2018). The Practice of Reproducible Research: Case Studies and Lessons from the Data-Intensive Sciences. Oakland, CA: University of California Press. E-book.
Findable, Accessible, Interoperable, and Reusable (FAIR) data and materials
Wilkinson, M. D., Dumontier, M., Aalbersberg, I. J. J., Appleton, G., Axton, M., Baak, A., Blomberg, N., et al. (2016). The FAIR Guiding Principles for scientific data management and stewardship. Scientific Data, 3, 160018. Retrieved from http://dx.doi.org/10.1038/sdata.2016.18
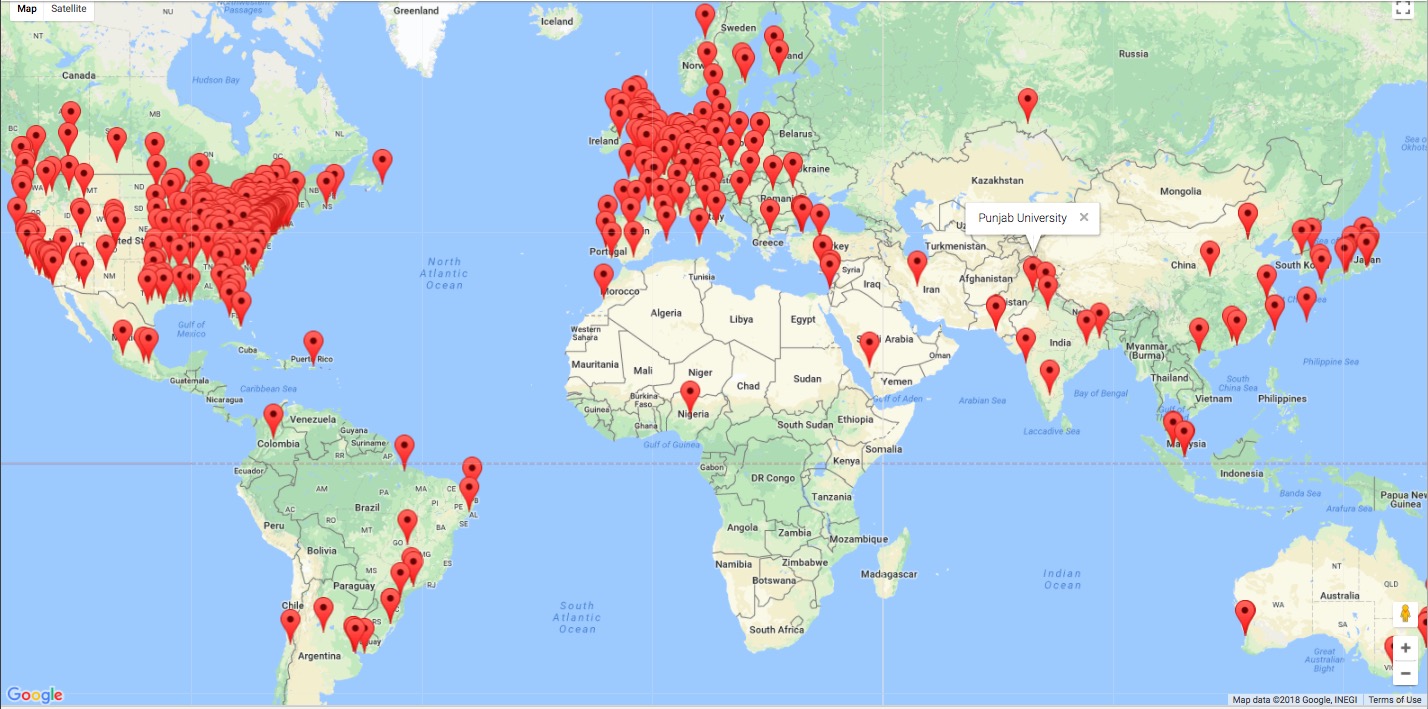
Open sharing among authorized researchers, not public
Share with community of researchers, not study-by-study
Share identifiable data with permission via consistent access levels
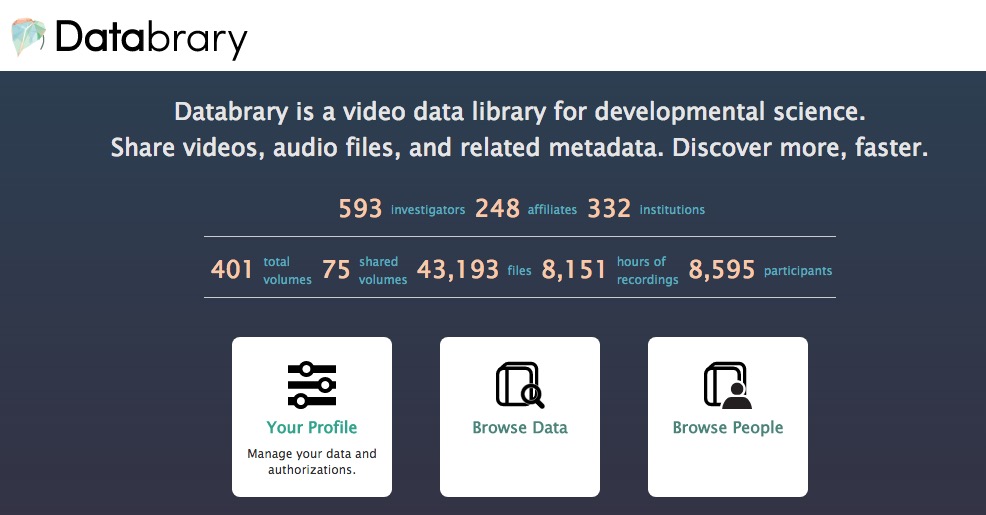
How Databrary differs
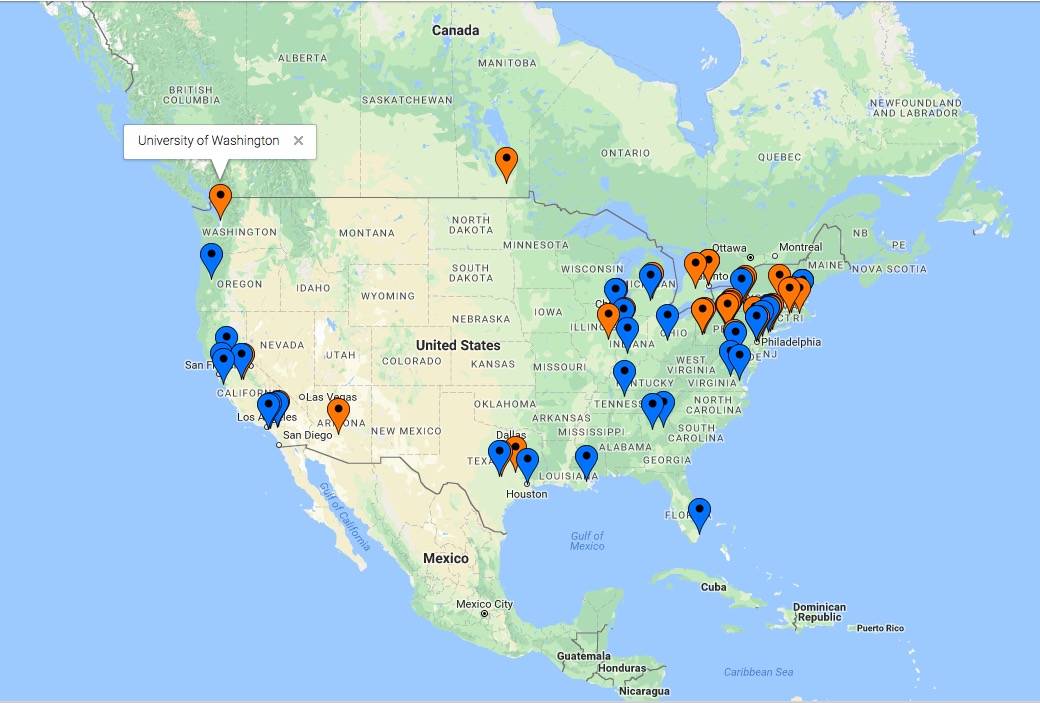
Store, search across, filter among participant & session characteristics
Active (during study) curation reduces post hoc burden
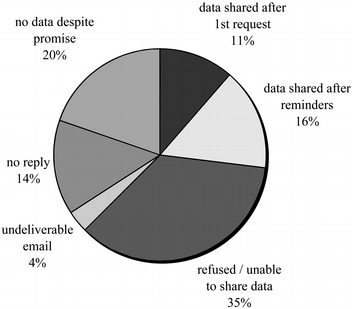
Gilmore, R. O., Kennedy, J. L., & Adolph, K. E. (2018). Practical Solutions for Sharing Data and Materials From Psychological Research. Advances in Methods and Practices in Psychological Science, https://doi.org/10.1177/2515245917746500
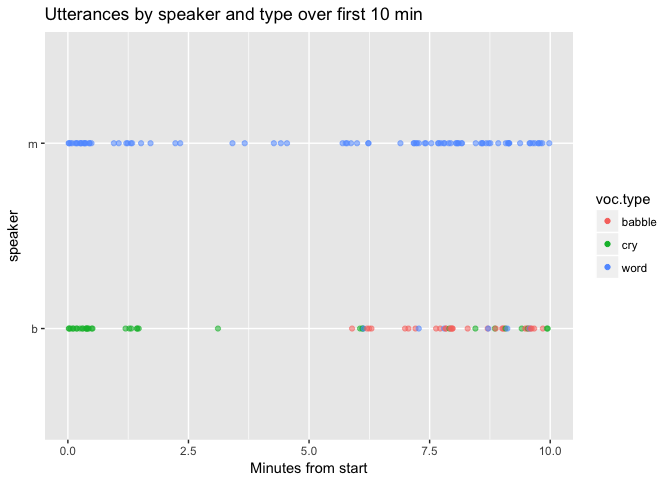
Play & Learning Across a Year (PLAY) Project
Play is the central context and activity of early development
What do parents and infants actually do when they play?
Adolph, K., Tamis-LeMonda, C. & Gilmore, R.O. (2016). PLAY Project: Webinar discussions on protocol and coding. Databrary. Retrieved January 24, 2018 from https://nyu.databrary.org/volume/232
Adolph, K., Tamis-LeMonda, C. & Gilmore, R.O. (2016). PLAY Project: Materials. Databrary. Retrieved January 24, 2018 from https://nyu.databrary.org/volume/254.
Demographics + parent-report questionnaires about health, family, temperament, vocabulary
Ambient sound levels
Census block group geocoding
Data openly shared on Databrary
Adolph, K., Tamis-LeMonda, C. & Gilmore, R.O. (2016). PLAY Project: Materials. Databrary. Retrieved January 24, 2018 from https://nyu.databrary.org/volume/254.
Adolph, K., Tamis-LeMonda, C. & Gilmore, R.O. (2017). PLAY Pilot Data Collections. Databrary. Retrieved January 24, 2018 from https://nyu.databrary.org/volume/444
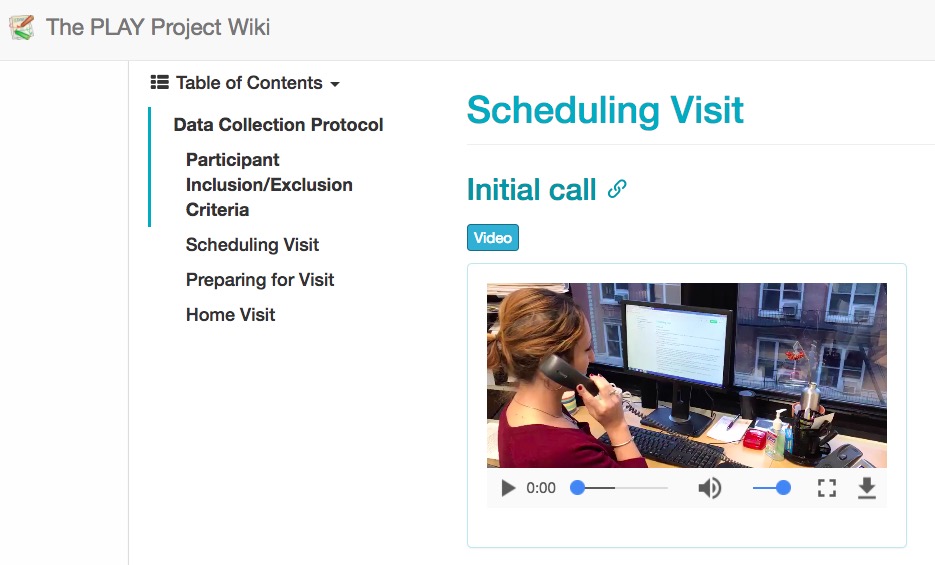
Video as data AND documentation
What questions would you ask about these sorts of data?
How could the data be made maximimally (re)useful?
On the horizon..
Scientific process management (LabNanny), project sync, dataset cloning
Bringing machine learning, computer vision to behavioral scientists
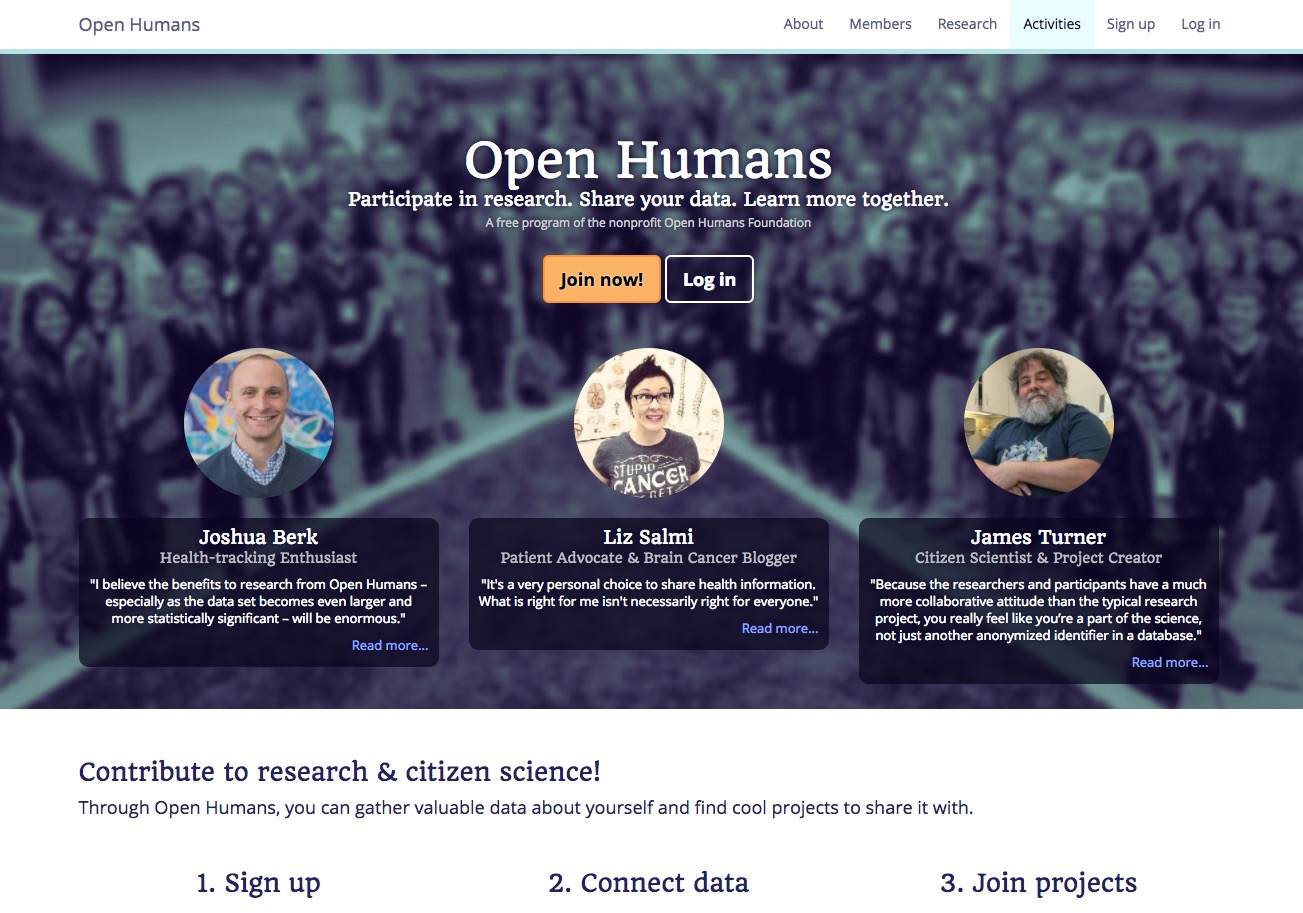
And/or let individuals own/profit from their own data
Boker, S. M., Brick, T. R., Pritikin, J. N., Wang, Y., von Oertzen, T., Brown, D., Lach, J., et al. (2015). Maintained Individual Data Distributed Likelihood Estimation (MIDDLE). Multivariate behavioral research, 50(6), 706–720. Taylor & Francis. Retrieved from http://dx.doi.org/10.1080/00273171.2015.1094387
This talk was produced on 2018-02-14 in RStudio using R Markdown and the reveal.JS framework. The code and materials used to generate the slides may be found at https://github.com/gilmore-lab/2018-02-14-quant-dev/. Information about the R Session that produced the code is as follows:


 (
( (
(
 (
(


 (
(
 (
( (
( (
(
 (
(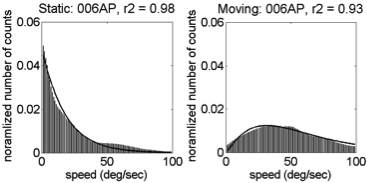
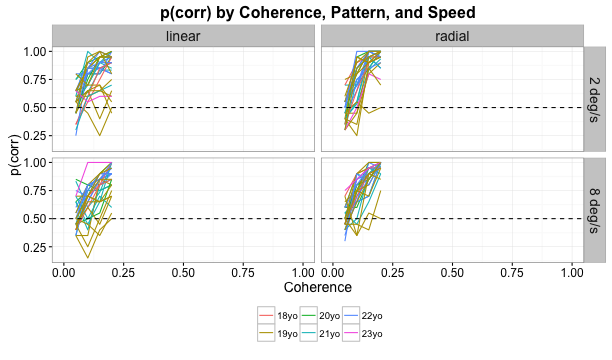
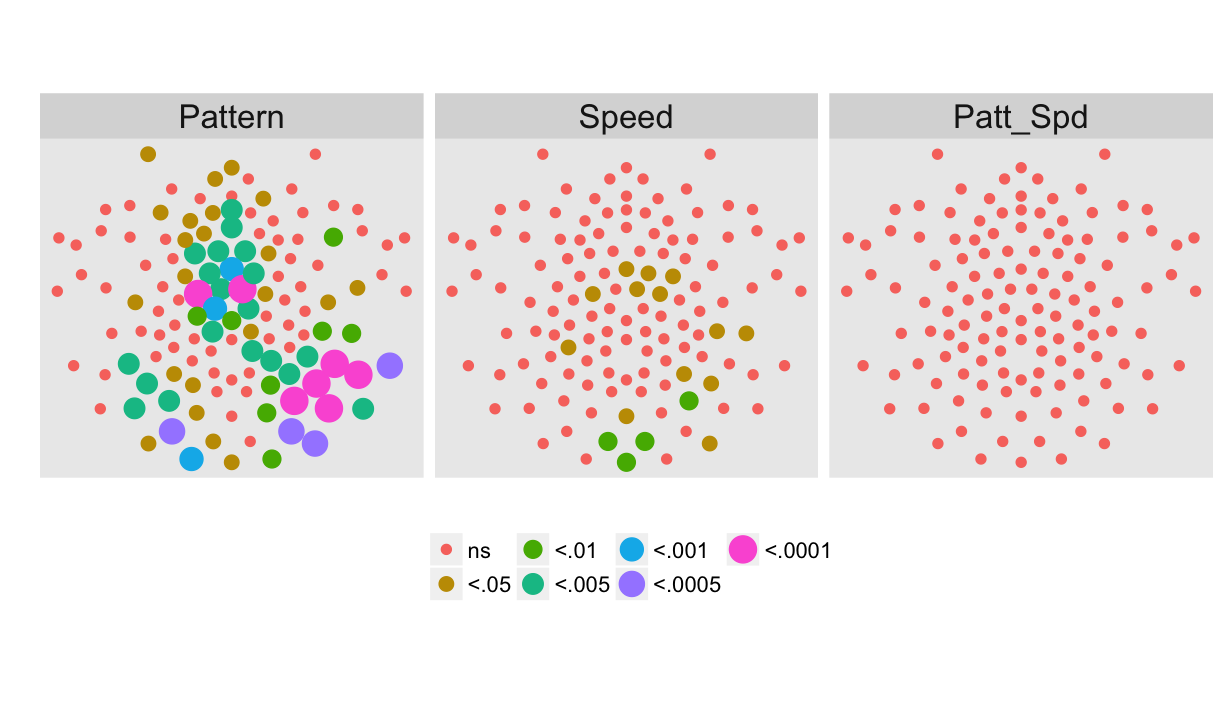
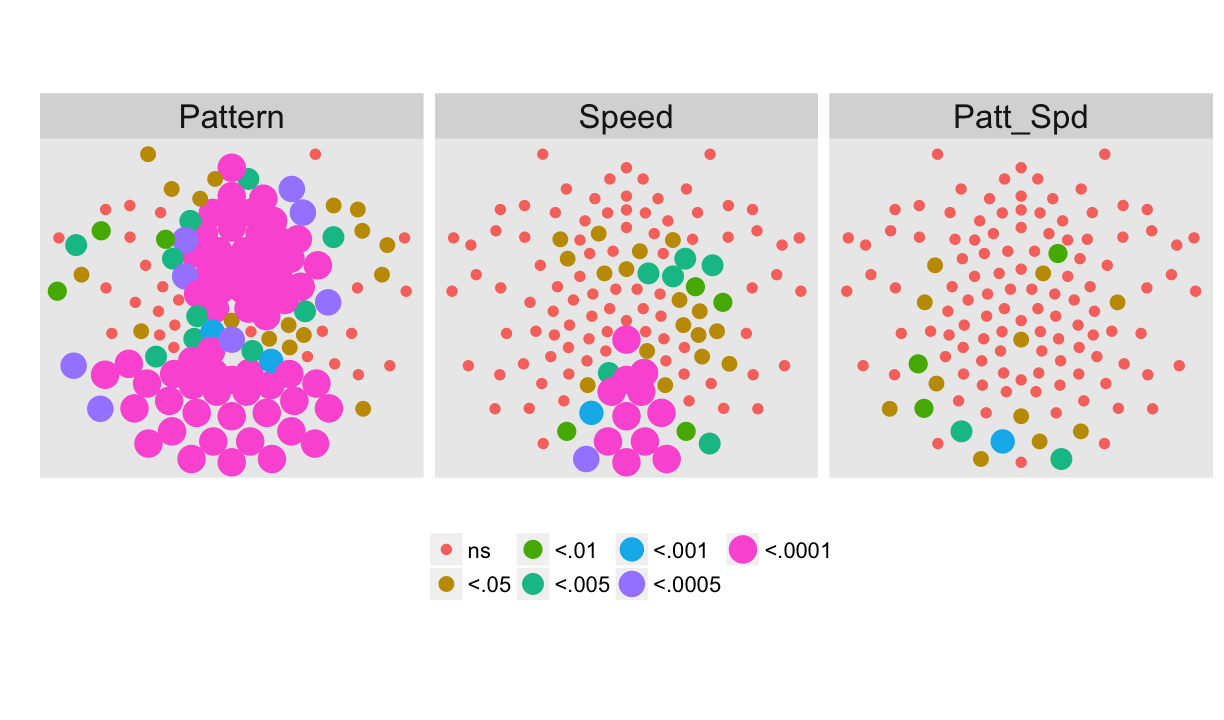
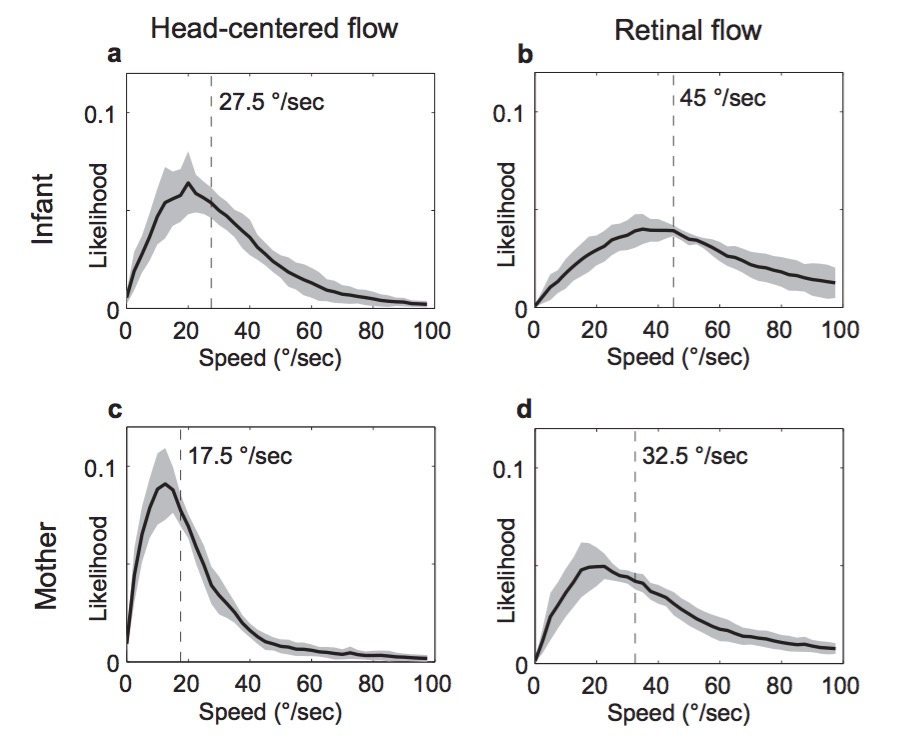
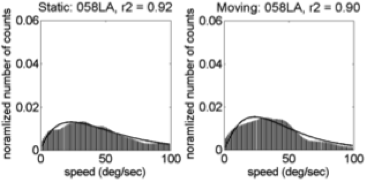
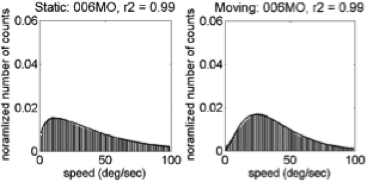 (Gilmore et al, 2015)
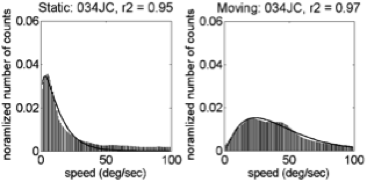
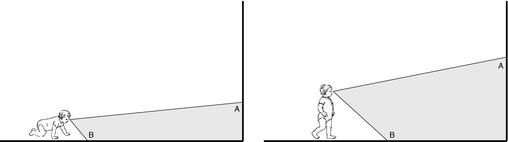
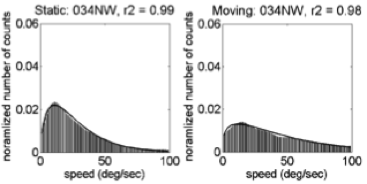 (Gilmore et al, 2015)
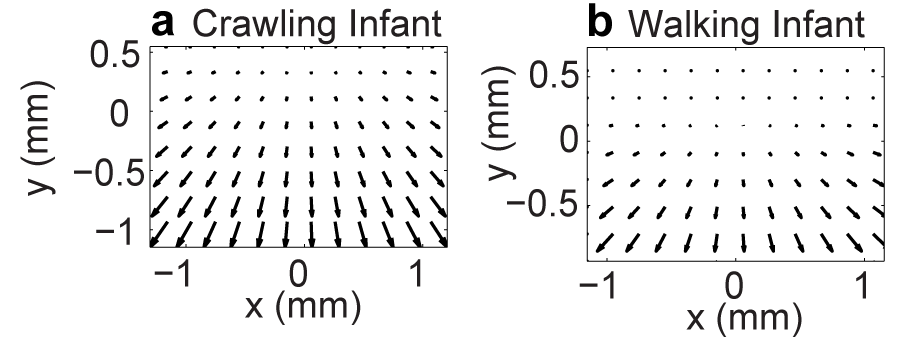
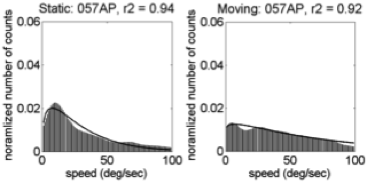
 (Gilmore et al, 2015)
 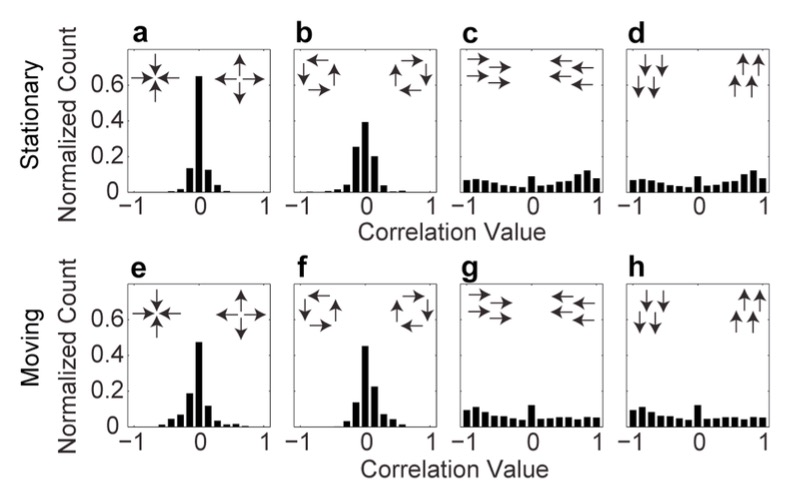 (
( (
( (
( (
(