Reproducibility in Computationally Intensive Behavioral Research
Rick O. Gilmore
2017-09-07 17:03:01
![]()

![]()
 (
( (
(
 (
(

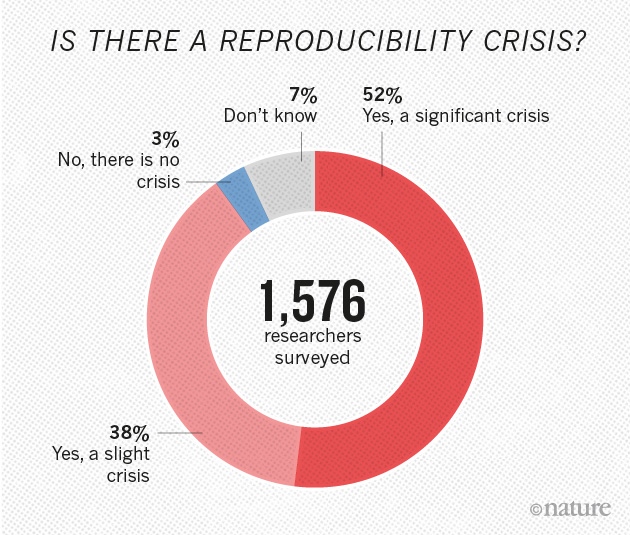
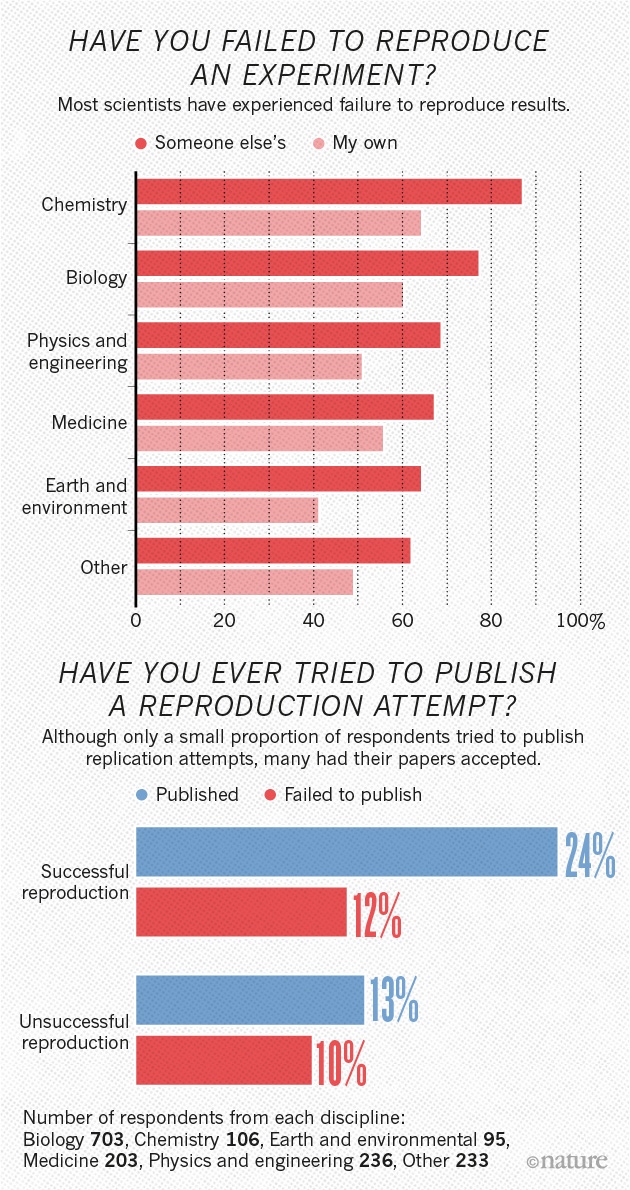
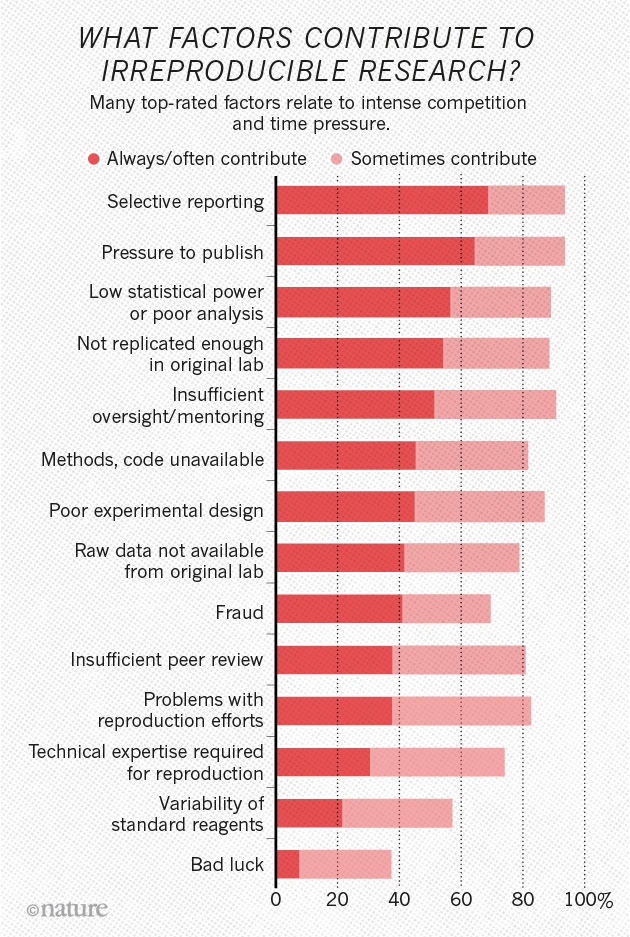
The sin of unreliability
Studies are underpowered
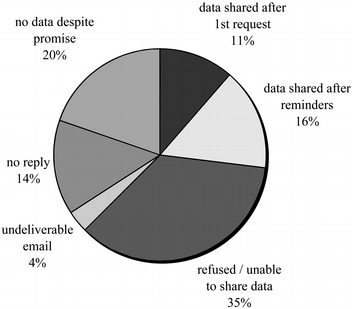
The sin of hoarding…
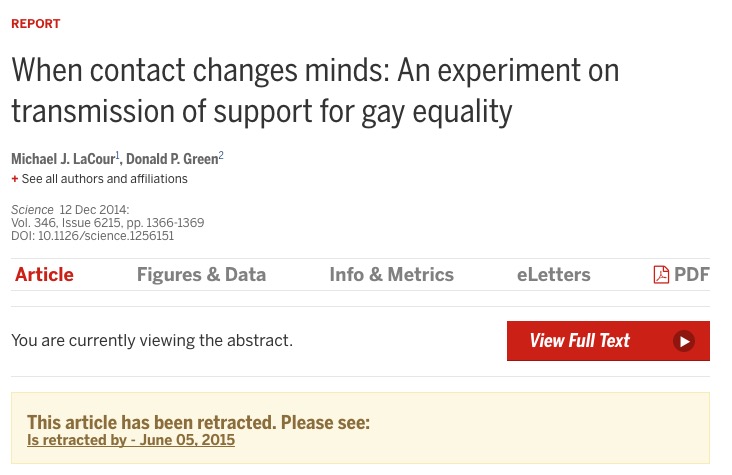
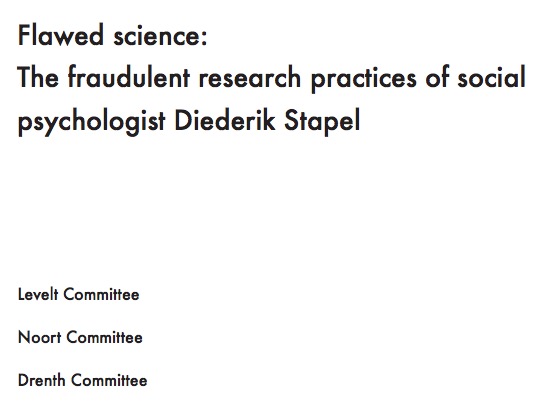
The sin of corruptibility…

The sin of hurrying…

Embedded in networks


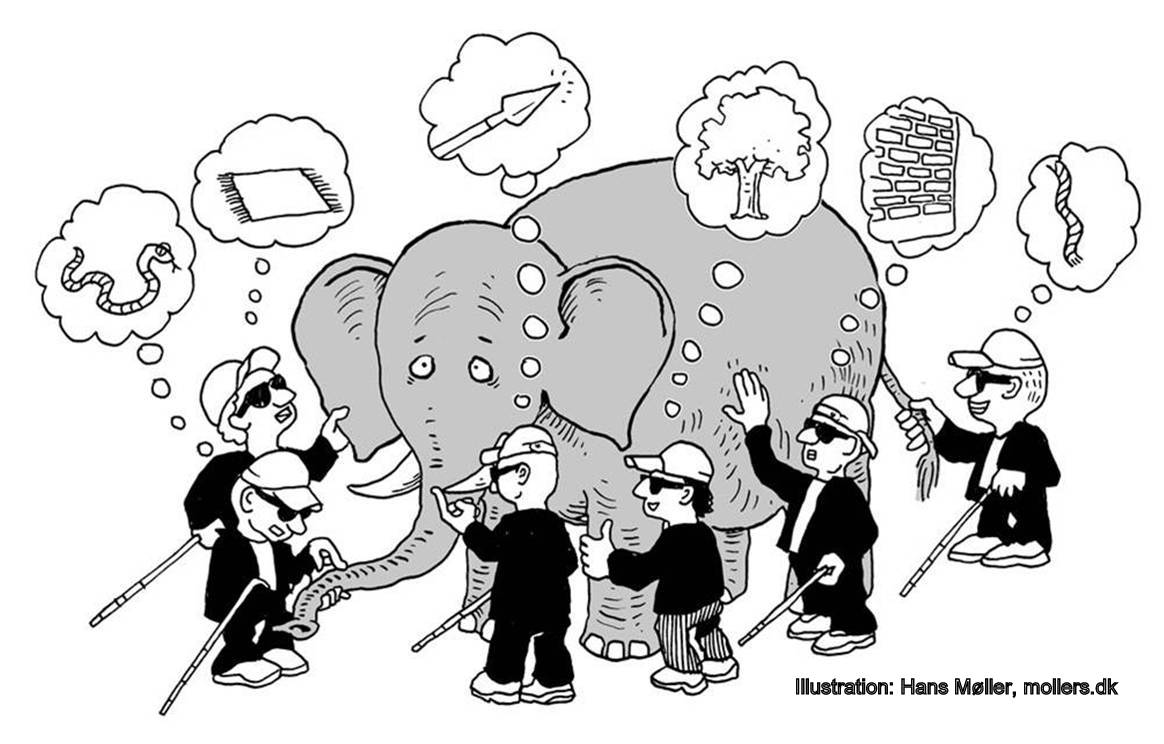
“Mind-reading” in fMRI
 (
(Children’s behavior

Adults’ behavior
Children’s brain responses
 (
(Adults’ brain responses
 (
( (
(Findings

 (
(Motion speeds - 6 weeks
U.S. | India 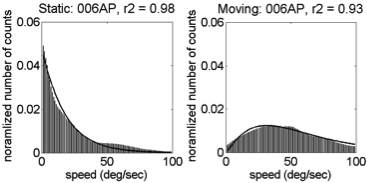
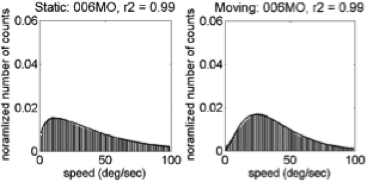 (Gilmore et al, 2015)
Motion speeds – 34 weeks
U.S. | India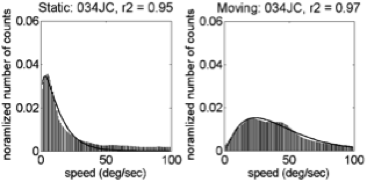
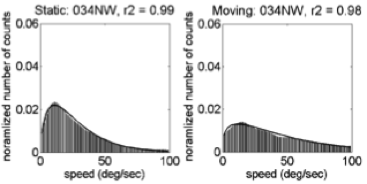 (Gilmore et al, 2015)
Motion speeds – 58 weeks
U.S. | India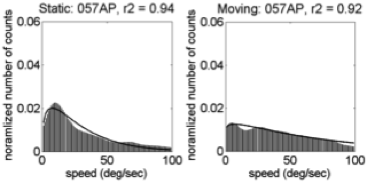
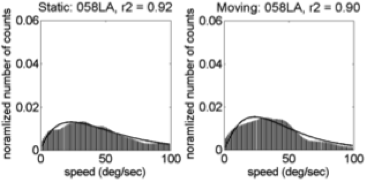 (Gilmore et al, 2015)
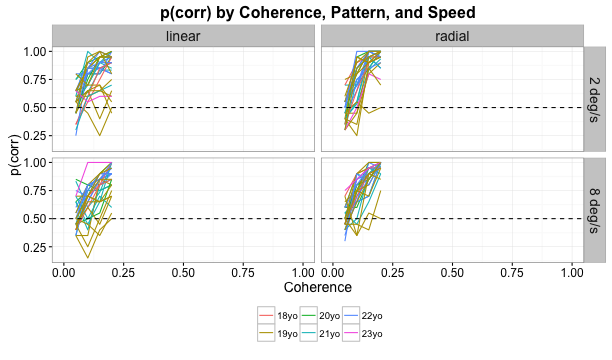
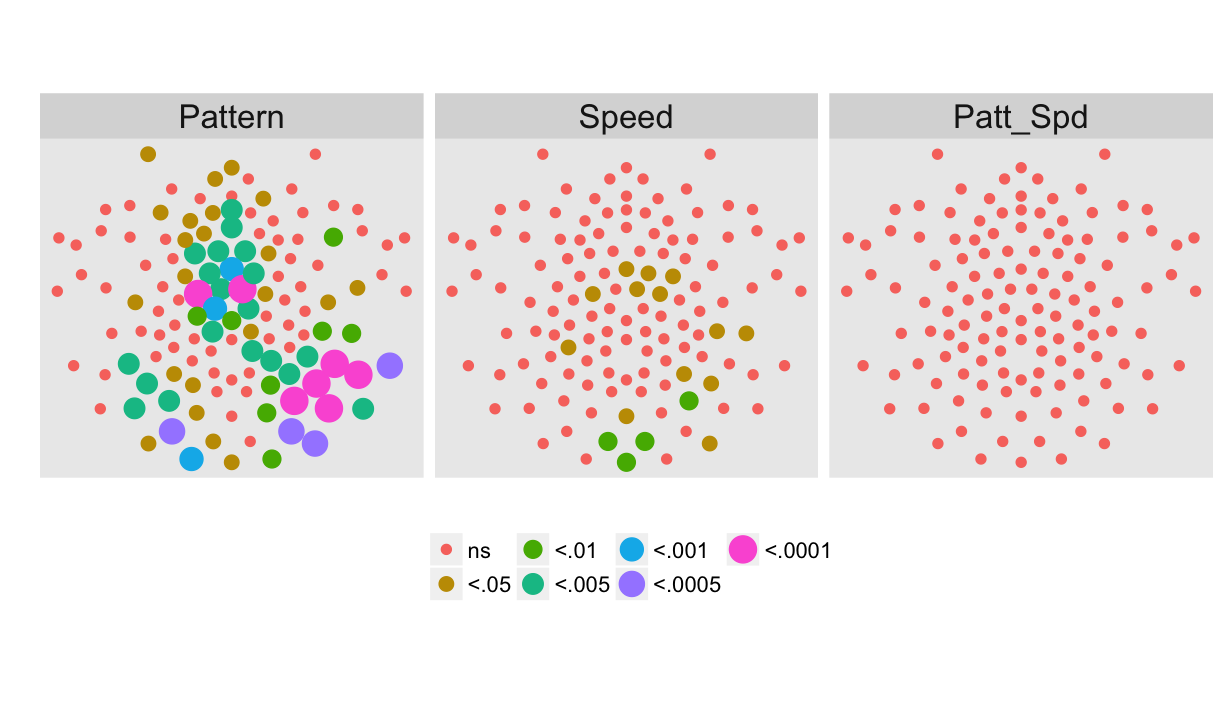
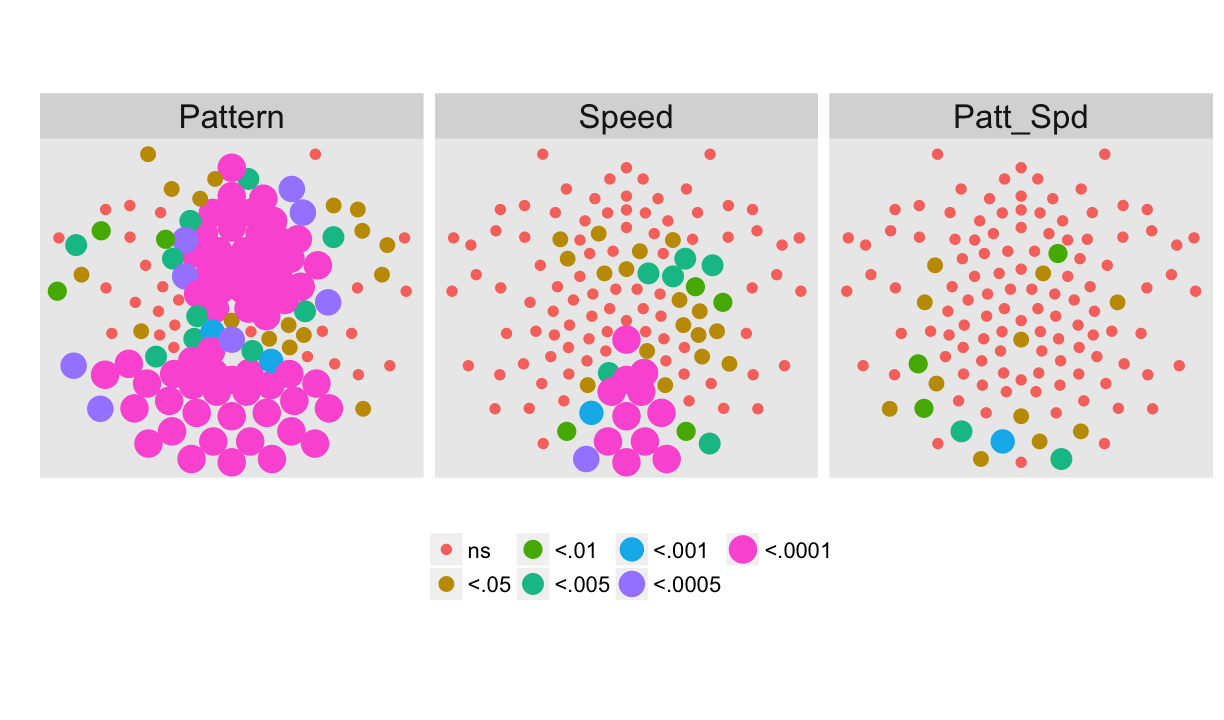
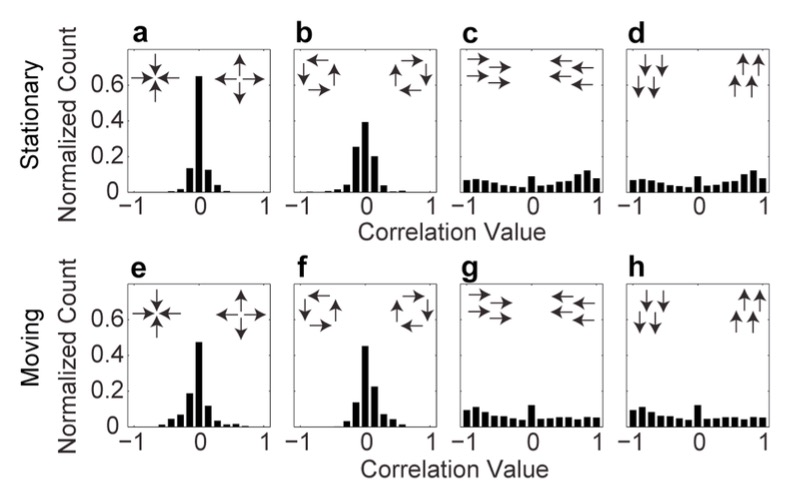
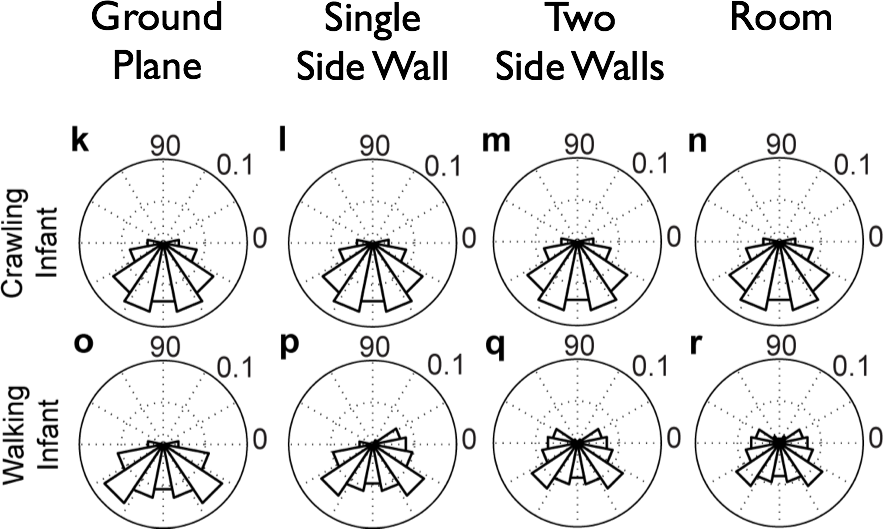
Linear > radial patterns
 (
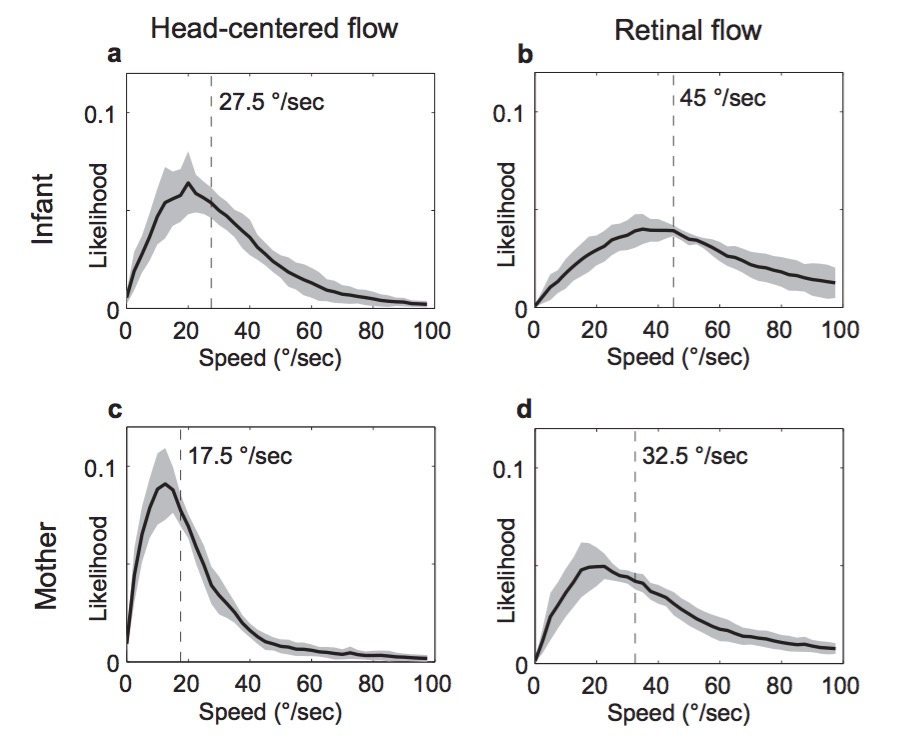
(Parameters For Simulation
| Parameter | Crawling Infant | Walking Infant |
|---|---|---|
| Eye height | 0.30 m | 0.60 m |
| Locomotor speed | 0.33 m/s | 0.61 m/s |
| Head tilt | 20 deg | 9 deg |
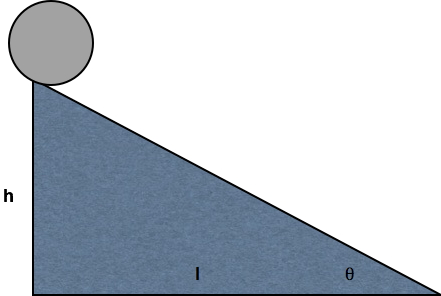
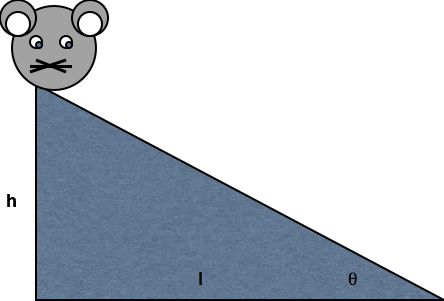
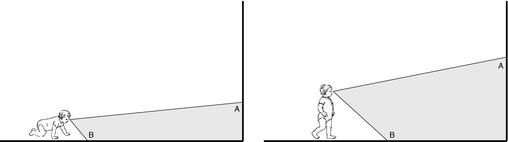 (
(Simulating Flow Fields
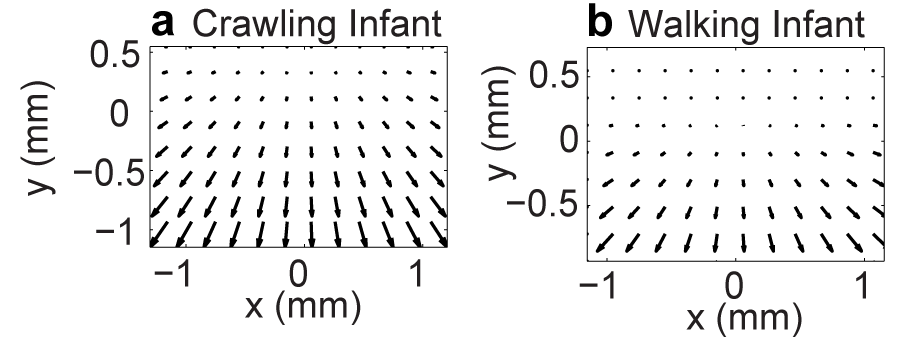 (
( (
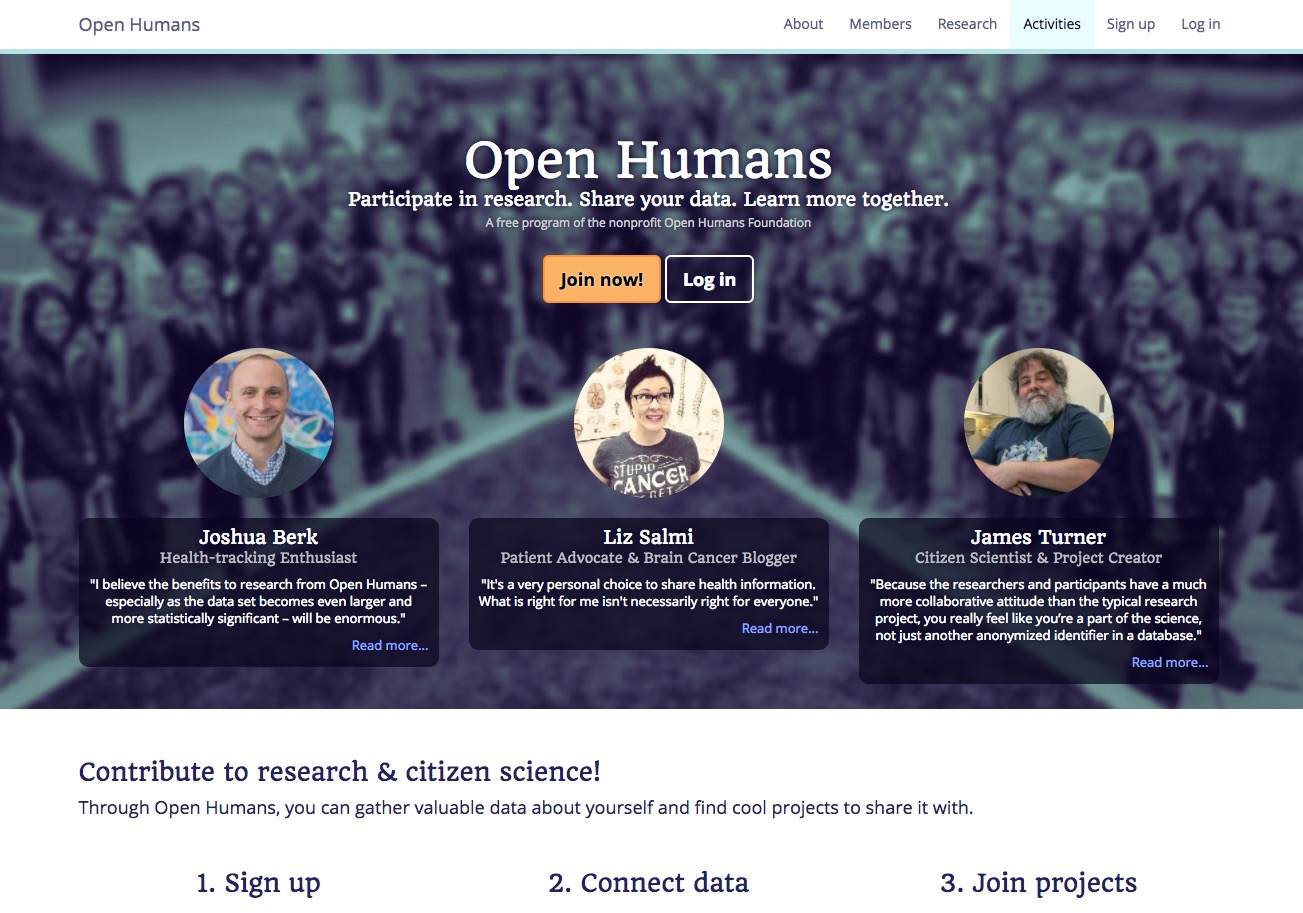
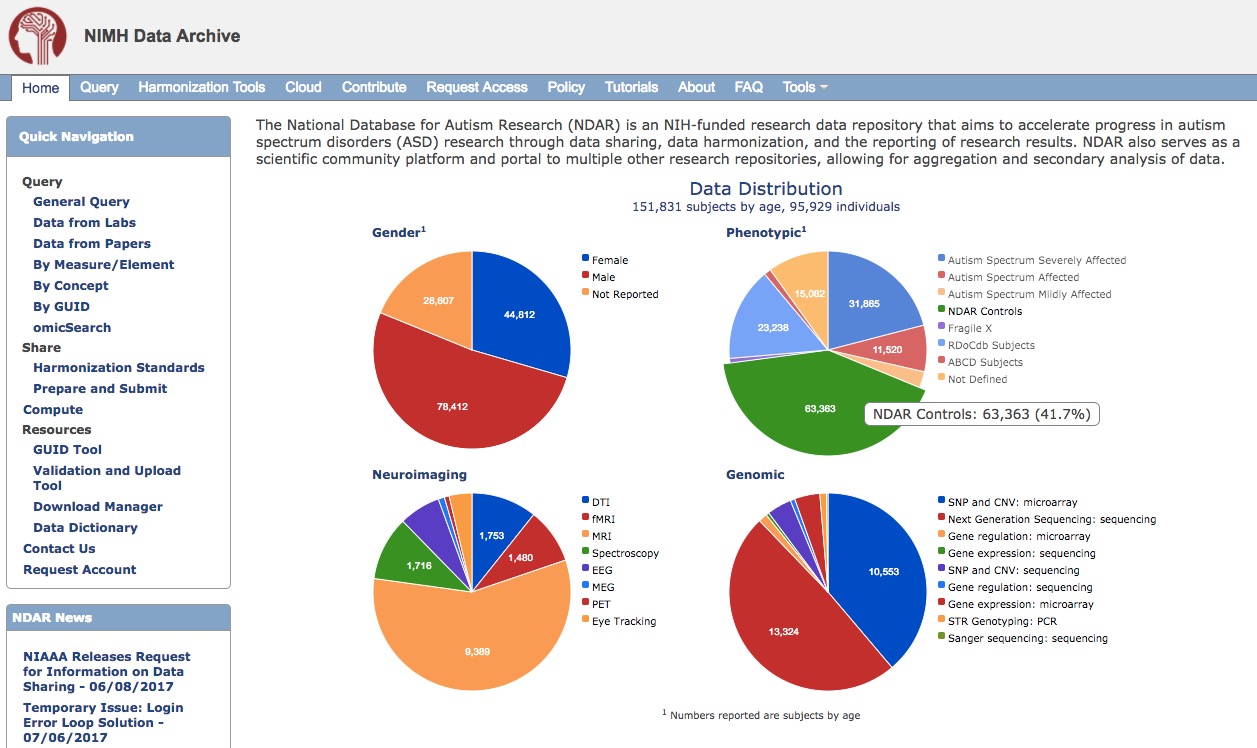
(Share materials, code, raw data


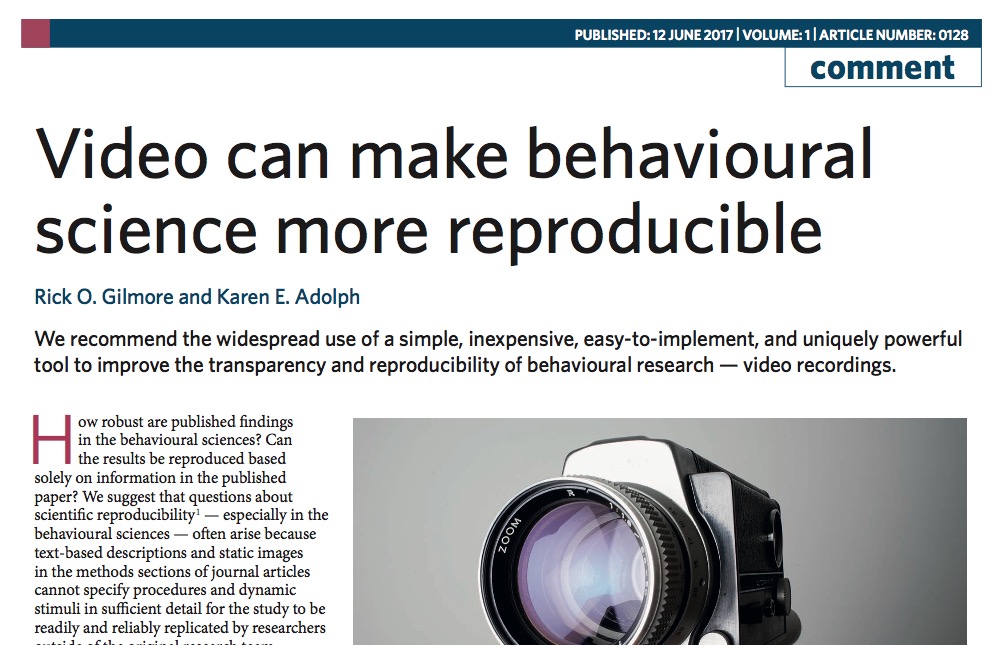
Collect & share video as data and documentation
Increase sample sizes

Standardize metadata
- participants (age, gender, race/ethnicity, …)
- settings (times, dates, places)
- measures & tasks


Data from diverse domains
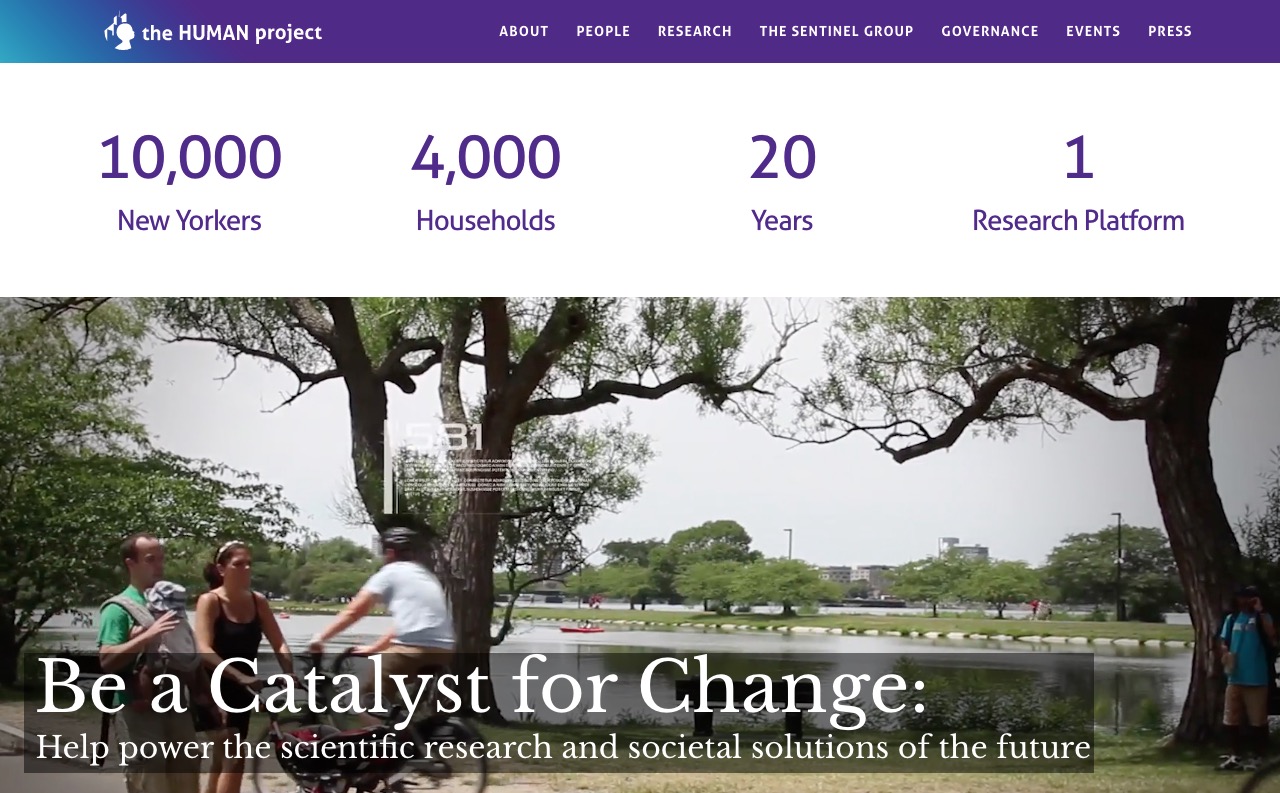


Link measures across people

Search, filtering by personal characteristics
Curate data & materials as they are generated
Consistent, clear sharing permissions structure